462-Mile Project Review Stymies Competitive DOT Proposal
Existing Conditions for Bid Evaluation

Problem
Roy Jorgensen Associates wanted to submit a proposal to the Tennessee DOT within a small, 5-week bid window that included realistic costs for comprehensive and routine maintenance of 15 county territories with a wide variety of assets.
Solution
Roy Jorgensen Associates hired PILLAR to assist with cursory project review of asset quantities and condition assessments of 13 different asset classifications along 462 centerline miles of Interstate right of way corridors under 2 separate contracts, as well as costs for comprehensive and routine maintenance for sections of the interstates around the Nashville area.
Approach
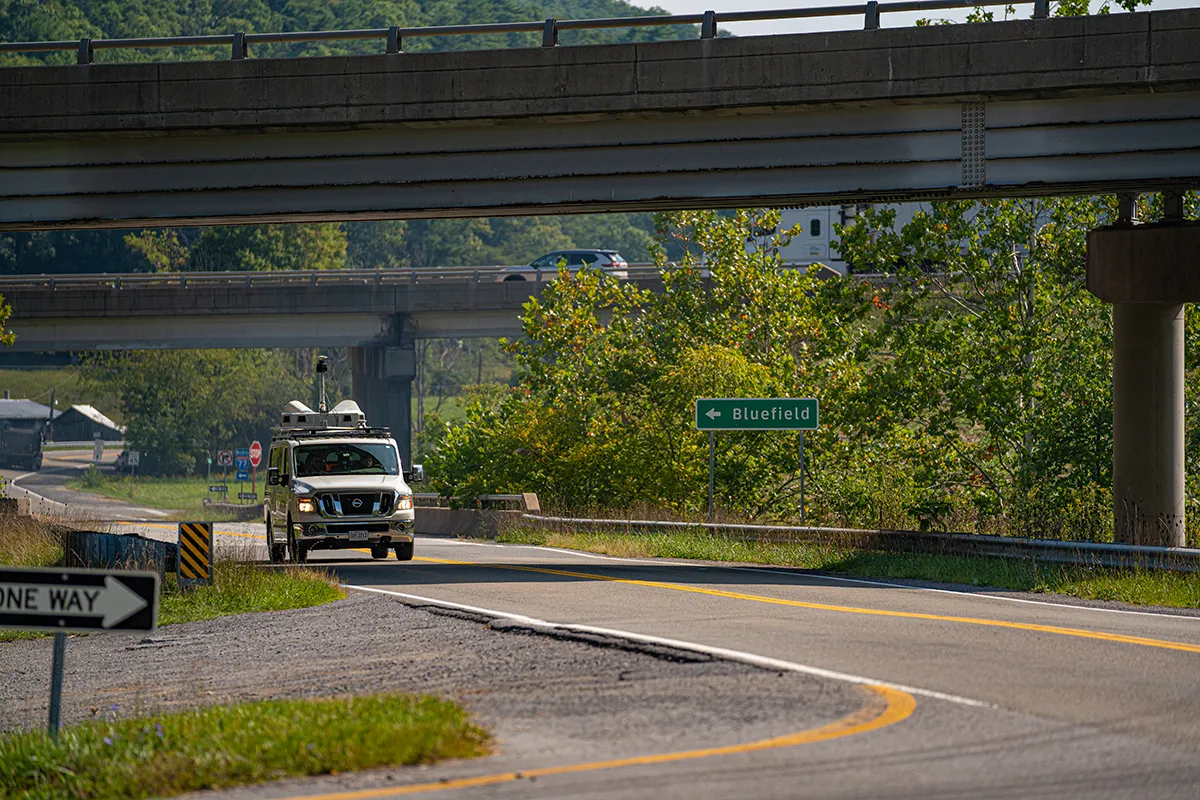
PILLAR completed the work using a windshield survey, random spot checks, desktop street view review, desktop GIS analysis, Mobile LiDAR, street-level imagery, and Tennessee DOT’s extensive GIS database of assets to help evaluate the 15 specified counties.
The windshield survey was completed by a 2-man team using custom-built mobile applications that logged asset type, defect, and corresponding locations to the roadway, shoulder, landscaped, and vegetation areas within the right-of-way limits, signs, guardrail, and barrier wall. PILLAR used mobile LiDAR and street level imagery during the windshield survey to collect supplemental data which was processed and extracted through AFES.
It was especially important for our team to identify defects when conducting the field condition assessment. Random, boots-on-the-ground spot checks were performed for assets not easily visible from the windshield survey including ditches, drainage structures, and fences. Records were sufficiently detailed to estimate specific work plan quantities necessary to bring the asset up to a state of good repair as identified in the RFP scope of services.
The desktop street view review incorporated the Tennessee DOT’s GIS data in concert with street level software to assess assets like mile markers and attenuators.
The desktop GIS analysis was used to assess the condition of turf, brush and trees.
Work was completed in approximately 3 weeks to allow 2 weeks to review collected data and incorporate results into Jorgensen’s cost submittal. Deliverables included data outputs in Tennessee DOT MMS activity codes, formats and unit of measure rated against Tennessee DOT MQA criteria, images and photographs of points of interest, high-frequency defects and high-value deficiencies, summary charts, and visual maps with defect density mapping.
Let's Talk
Complete the form below to start a conversation with PILLAR.
